
Bitcoin rally Bitcoin’s price pivoted on Sunday after a week of incessant selling pressure that plagued the aggregate cryptocurrency market. The
Bitcoin rally
Bitcoin’s price pivoted on Sunday after a week of incessant selling pressure that plagued the aggregate cryptocurrency market.
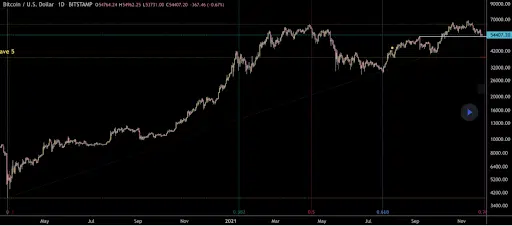
The BTC/USD 1W chart below from newbietrad shows BTC’s price clinging to the .382 fib level at $53,707, at the time of writing. Bitcoin’s price rallied during the day’s second 12 hour candle and finished the day +$2,489.
The next level for bitcoin bulls to pursue overhead is the 0.236 fib level at $60k. Bitcoin bears however are trying to crack the 0.382 at $53,7k and then test the 0.5 fib at $48,9k.
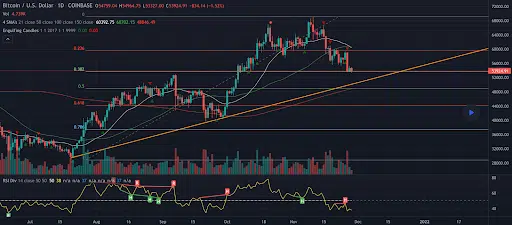
Another example of how important the $50k-$53k level is on multiple time frames is the BTC/USD 1D chart below from AlirezaAzarm.
BTC’s current trendline is over 600 days old on this timescale and if the trend is broken at $53k it could mark the beginning of a longer bear market.
The Fear and Greed Index is 33 Fear and +6 from Sunday’s reading of 27 Fear.
BTC’s 24 hour price range is $53,672-$57,748 and its 7 day price range is $53,672-$59,216. Bitcoin’s 52 week price range is $17,579-$69,044.
The price of bitcoin on this date last year was $18,169.
The average price of BTC for the last 30 days is $60,907.
Bitcoin [+4.54%] closed its daily candle worth $57,325 and in green figures on Sunday for the third day out of the last four days.
Ethereum Analysis
Ether’s price also rallied on Sunday and finished Sunday’s daily candle +$203.96.
One interesting chart for Ether traders to consider is the ETH/USD 1D chart below from YMGroup and traders will note the importance of the $3,650 level.
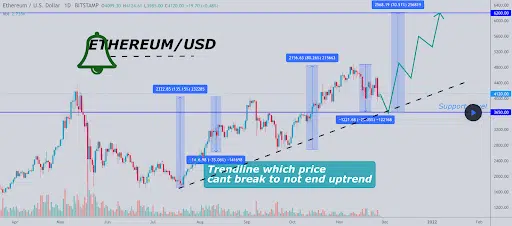
Ethereum trendline to reach $6k level
If Ether bulls can successfully hold that long term trendline then their ultimate target on the above chart is the $6,2k level.
The price of ETH on this date in 2020 was $574.75.
The average price of ETH for the last 30 days is $4,421.
Ether [+4.98%] closed its daily candle worth $4,297 on Sunday and has finished in green digits for three out of the last four days.
LUNA Analysis
LUNA’s price was one of the leaders on Sunday and finished its daily candle +$6.23.
The LUNA/USD 4hr chart below from ForecastCity_World shows LUNA’s breakout of a bear flag with 5 profit taking levels according to the chartist.
Bullish traders may be looking to take profits on LUNA if its price backtests its breakout successfully. The overhead targets for bulls are at $46.96, $48.67, $50.28, $52.43, and $54.99.
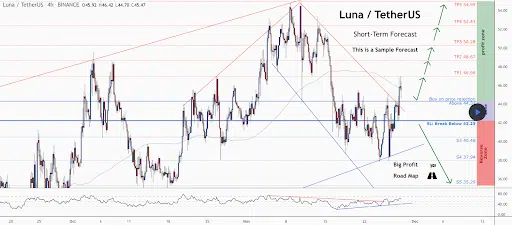
LUNA’s targets
Conversely, LUNA bears will be targeting $42.23, $40.48, $37.94, and $35.29 to the downside if they can reverse the course of LUNA’s price action.
Terra’s 24 hour price range is $42.67-$50.41 and its 7 day price range is $38.06-$50.41. LUNA’S 52 week price range is $.38-$54.77.
Terra’s price on this date last year was $.379.
The average price for LUNA over the last 30 days is $46.41.
Terra [+14.18%] closed its daily candle on Sunday worth $50.15 and in green figures for back to back days.
Fonte:Cryptonomist.it